Main Dashboard
On your main dashboard you can see reports and summaries of your campaigns for a certain time period. Four tabs refer to different campaigns you are or have been running. The long tab on the top includes values connected with your performance.
- Blue
- E-shop revenue attributed to Yottly – total revenue and revenue in certain channels – in a certain time period
- revenue of campaigns, which were created before selected time period, is also taken into account if the conversion was made in the selected time period. That is why this total revenue (Blue) can be higher than sum of revenue of selected campaigns (Red)
- source: Google Analytics (everything except Web personalisation where Yottly attribution is applied)
- Green
- Revenue, Number of new customers and number of orders in a certain time period
- only finished orders are taken into account
- source: your data feeds
- Red
- Number of orders and revenue attributed to certain Yottly campaigns which were sent in a certain time period
- source: Google Analytics
- other campaign statistics see here
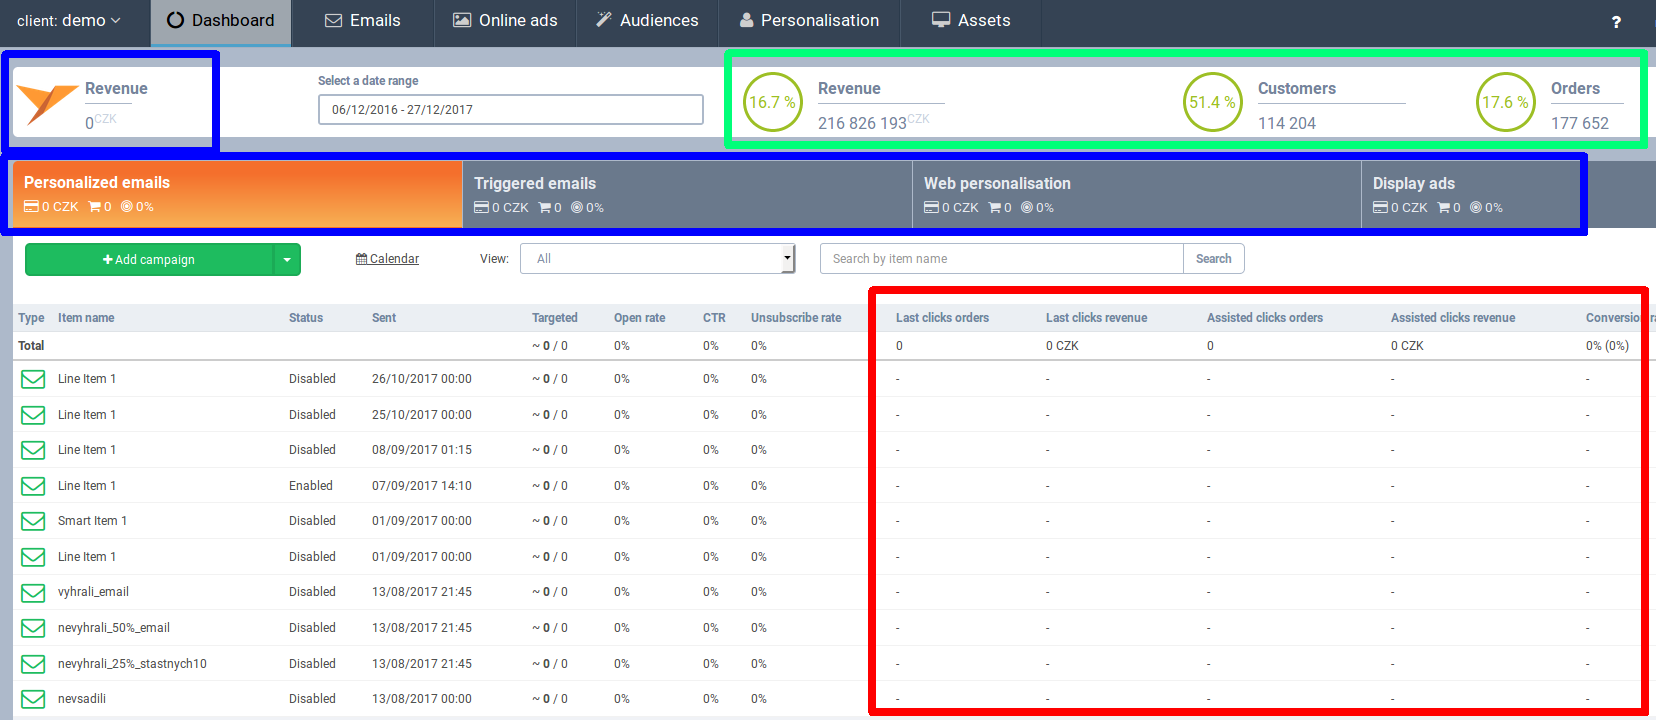
The certain period can be set in the boxes above the tabs.

For more detailed reports you can use Detail button in the right corner.
